i-dropout #10226
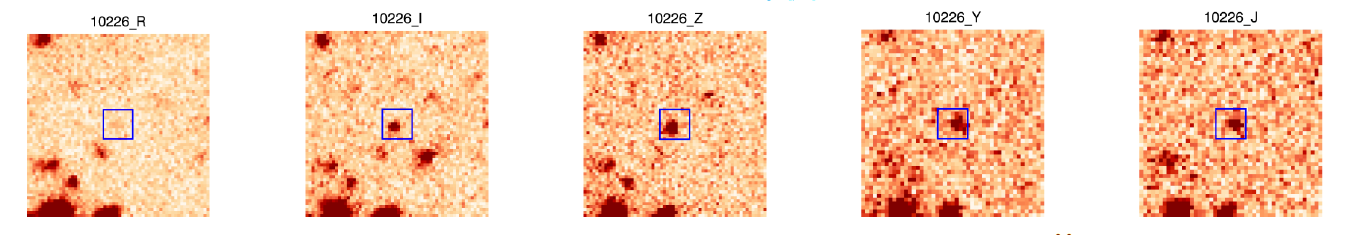
Postage samps (7" on a side) in the r, i, z, Y, J filters.
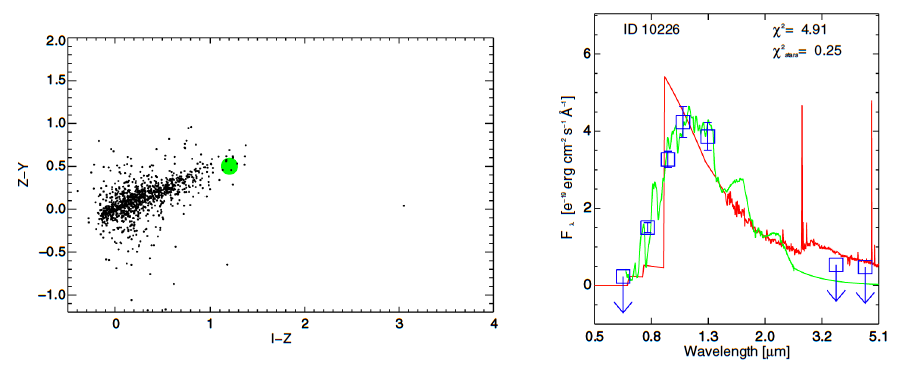
Left) Photometric colors diagnostic plot: the small black dots are stars in the field and the dashed line represents an extrapolation of the stellar locus based on the colors of M, L, and T-type dwarfs. The green point shows the colors of the secondary LBG candidate. Right) SED fitting: blue squares represent AB magnitudes in r, i, z, Y, J, and Spitzer/IRAC ch1 and ch2 bands with 1σ-error. The best fit is shown with a red line for galaxy and with a green line for stellar case solutions.